Ch 09. Stochastic Gradient Descen
Part.4 실습 SGD 적용하기
Stochastic Gradient Descent (SGD)
Load Dataset from sklearn
- In [1] :
import pandas as pd
import seaborn as sns
import matplotlib.pyplot as plt

from sklearn.preprocessing import StandardScaler
- In [2] :
from sklearn.datasets import fetch_california_housing
california = fetch_california_housing()
- In [3] :
df = pd.DataFrame(california.data, columns=california.feature_names)
df["Target"] = california.target
df.tail()
- Out [3] :

- In [4] :
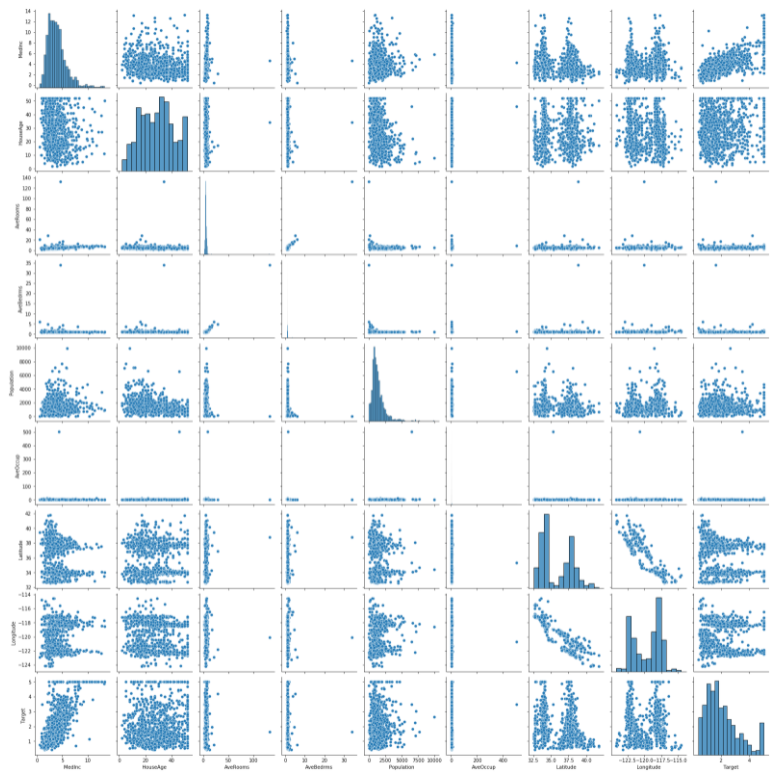
sns.pairplot(df.sample(1000))
plt.show()

- In [5] :
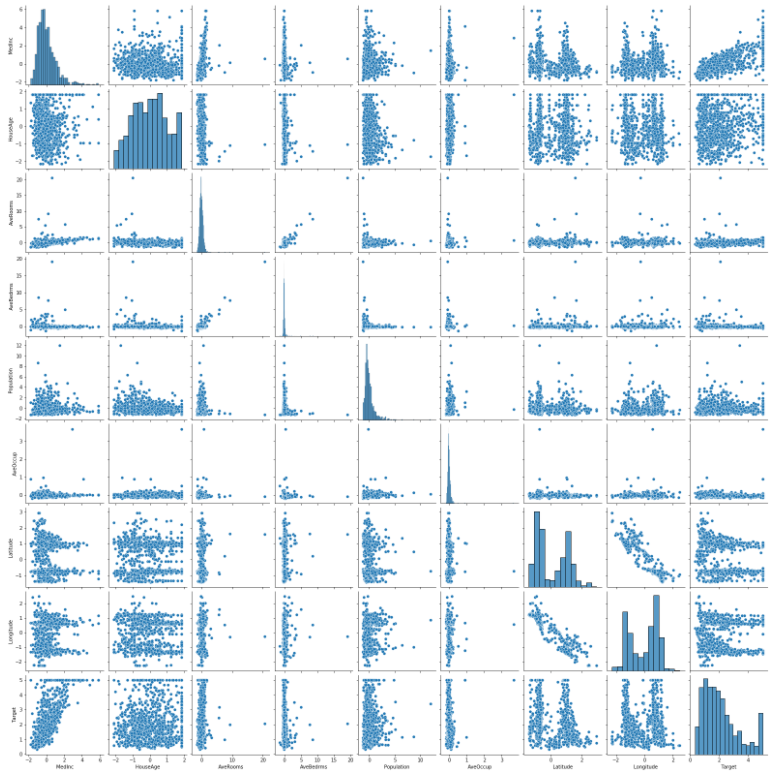
scaler = StandardScaler()
scaler.fit(df.values[:, :-1])
df.values[:, :-1] = scaler.transform(df.values[:, :-1])
- In [6] :
sns.pairplot(df.sample(1000))
plt.show()

Train Model with PyTorch
- In [7] :
import torch
import torch.nn as nn
import torch.nn.functional as F
import torch.optim as optim
- In [8] :
data = torch.from_numpy(df.values).float()
data.shape
-
Out [8] : torch.Size([20640, 9])
-
In [9] :
x = data[:, :-1]
y = data[:, -1:]

print(x.shape, y.shape)
torch.Size([20640, 8]) torch.Size([20640, 1])
- In [10] :
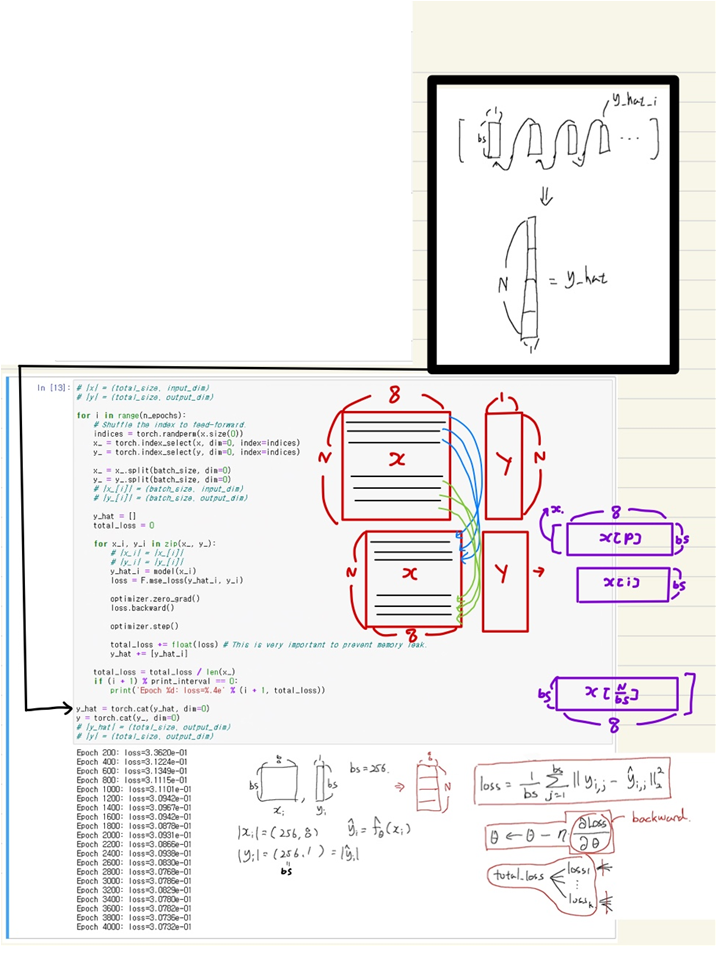
n_epochs = 4000
batch_size = 256
print_interval = 200
learning_rate = 1e-2
Build Models
- In [11] :
model = nn.Sequential(
    nn.Linear(x.size(-1), 6),
    nn.LeakyReLU(),
    nn.Linear(6, 5),
    nn.LeakyReLU(),
    nn.Linear(5, 4),
    nn.LeakyReLU(),
    nn.Linear(4, 3),
    nn.LeakyReLU(),
    nn.Linear(3, y.size(-1)),
)

model
Sequential( (0): Linear(in_features=8, out_features=6, bias=True) (1): LeakyReLU(negative_slope=0.01) (2): Linear(in_features=6, out_features=5, bias=True) (3): LeakyReLU(negative_slope=0.01) (4): Linear(in_features=5, out_features=4, bias=True) (5): LeakyReLU(negative_slope=0.01) (6): Linear(in_features=4, out_features=3, bias=True) (7): LeakyReLU(negative_slope=0.01) (8): Linear(in_features=3, out_features=1, bias=True) )
- In [12] :
optimizer = optim.SGD(model.parameters(), lr=learning_rate)

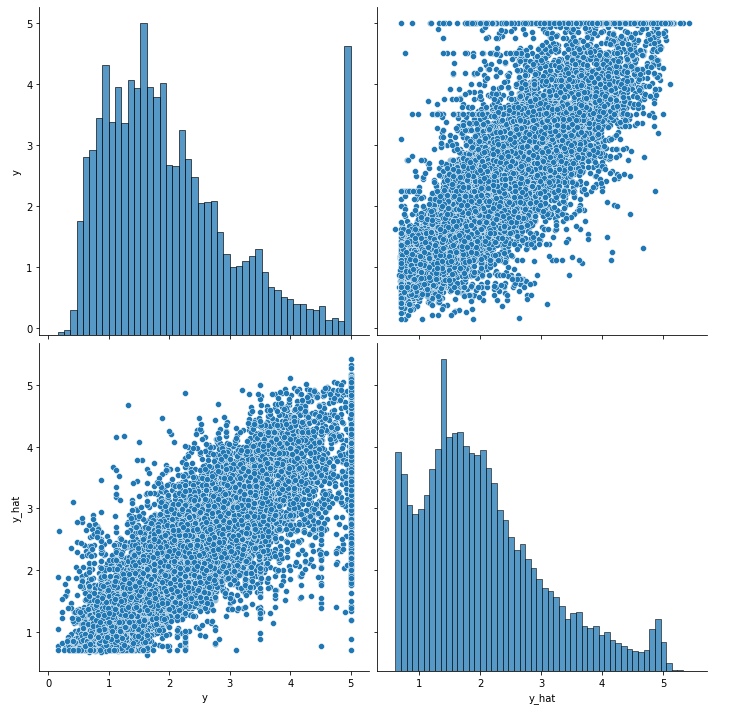
Let’s see the result!
- In [14] :
df = pd.DataFrame(torch.cat([y, y_hat], dim=1).detach().numpy(),
                  columns=["y", "y_hat"])

sns.pairplot(df, height=5)
plt.show()
